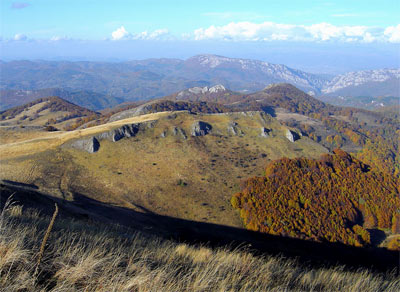
The Wind Farm "Tawas", which East Electric Company recently works up, is one of the
good windy zones on the East Cost of the United States.
The wind velocity anemometric measurement is still in progress (see the
general concluded data in the table below). They refer to both―the standard
height of 10 m, where they meet with the data about this region we
have been given with by one of the U.S. Air Force Metrological Center from more that ten years ago; and extrapolation by special
software to 80 m height to meet the requirements of the wind-turbine suppliers.On
this site 50 acres area about 7 wind turbines* of 2.5 up to 3.5 MW each
could be erected (planed 21 MW output installed power).
The following is intended for prospective investors who are
interested in development of a wind farms on the United States East
Cost.
Find full technological information for development of
wind farm on the land of County of Iosco, MI, the following
tangible and intangible long term assets:
Land in an area of 10 acres with change of land use designation
- from forest fund into industrial for
construction of wind farm.
Meteorological data: cross reference of wind velocity/density - direct measuring by anemometer and through ultrasound
facility on 30, 65 and 100 feet height
averaged covering a period of the last 10 years; the temperature and
humidity of the air for monthly one year average measured, compared with the information delivered by
several metrological centers.
Financial and engineering analyses of the suppliers' offers/purchase orders for the equipment.
Design for optimal location of the wind turbines.
Permission for starting industrial design, construction and other
certificates (optional).**
Environmental Study with Excel-based Time-table Pro-forma
Budgeting of cash flows with profitability evaluation and sensitivity analyzes concerning the wind velocity
fluctuation risk factor on annual bases.
Land procurement.
Wind Farm "Tawas", ultrasound measurement at 30 feet and software extrapolation to 100 yards height
Month:
1
2
3
4
5
6
7
8
9
10
11
12
AVERAGE
Expected annual average:
Speed on 30-f height
6.8
6.5
6.8
5.6
5.3
4.6
4.4
4.4
4.7
4.9
5.3
5.6
5.41
% hours with speed of >= 6 m/sec, 42%
Speed on 100-f height
9.28
8.87
9.28
7.64
7.23
7.48
7.15
7.15
7.64
7.96
7.23
7.64
7.88
% hours with speed of >= 6 m/sec, 100%
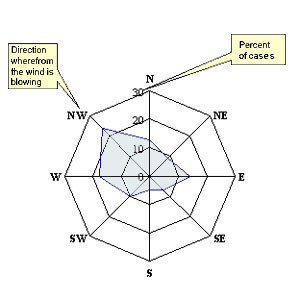
Destination
N
NE
EE
SE
S
SW
W
WN
TOTAL
Percent Cases
13
9
14
7
3
10
18
24
100
______________
*
The exact number and the generators' output power depend on both the construction design and supplier of the equipment for each site.
** These certificates follow the general construction design.
 Wind Farm
"Tawas"
Wind Farm
"Tawas"